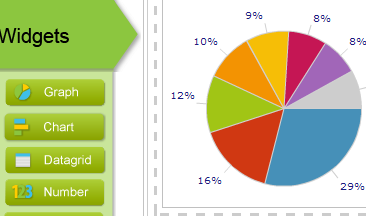
Usage & Entries Analytics

View how your form is being used.
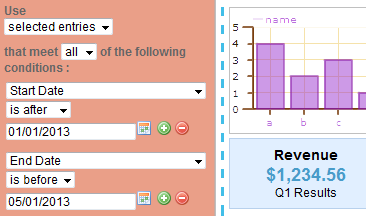
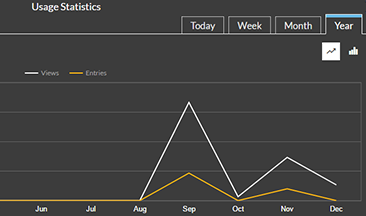
Daily, weekly, monthly, and yearly reports.

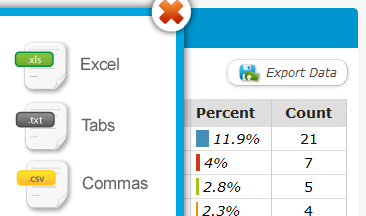
Quickly view the usage statistics for all your forms directly in our Form Manager. You can filter the statistics on your form views and entries by day, month, week, or year.

Easy Data Analysis and Reports

Quickly select relevant data.
Build graphs and charts.

No need to know how to use advanced spreadsheet options to create graphs from your data. Use our Reports Builder for a quick way to data analysis.

Segment Your Data

Use all or a portion of your entries.
Add as many conditions as you need.

Create reports based on filters like the time of submission, user's country or any other input from your form entries.

Customize Report Layout

Choose from a variety of layouts - pie charts, graphs, tables and more. Change layouts without ever affecting the content of reports.

Select the layout that works best to present your data clearly. If you add more widgets and rearrange your layout, the widgets rearrange automatically.

Embed & Share Your Reports

Secured URL reports you can just copy/paste.
Embed individual graphs, charts, and tables from your report.

You can easily share your reports with your audience. Embed a pie chart widget with the results of your poll into a blog post, and it will display up-to-date results.

Export Your Report

Create spreadsheet in an XLS, Tabs Delimited, or CSV format.

When EmailMeForm graphing and analysis just isn't enough, export your reports in a file format friendly to many popular spreadsheet and database applications.